
CREATE SALES REPORTS WITH GOOGLE DATA STUDIO
Accelerate your business with these expert tips on "Create sales reports with Google Data Studio". Analyse and discover this TIP!
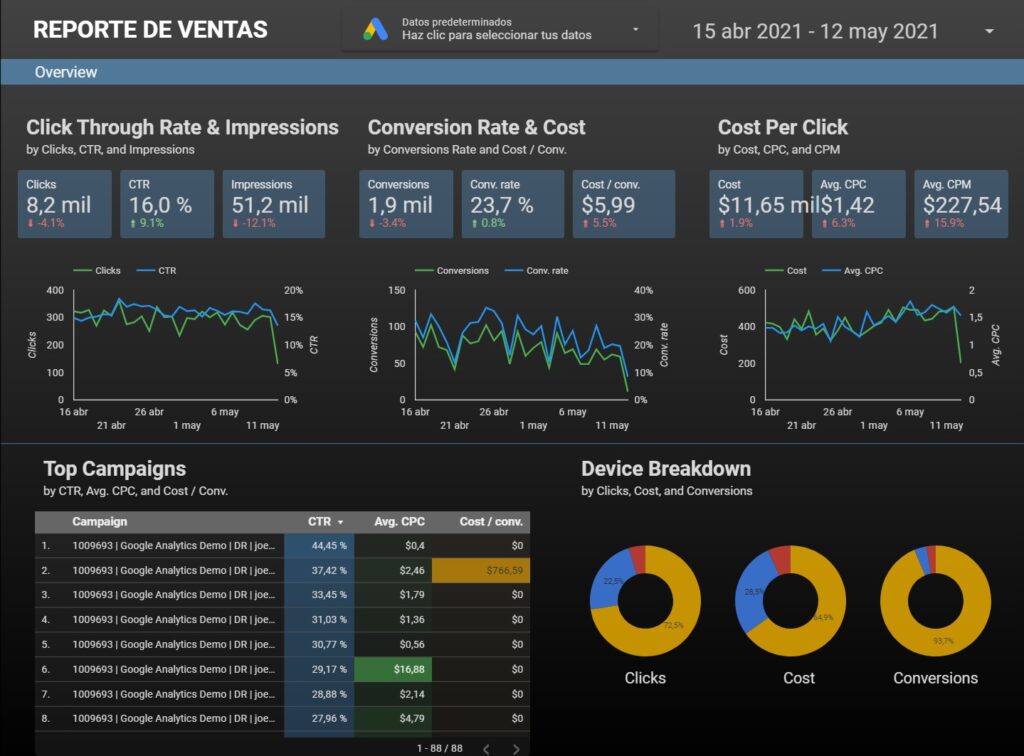
Google Data Studio is a fast and powerful data visualisation tool, which will allow you to link different traffic sources to create multiple dashboards that fit your visualisation needs, schedule sales reports, graphs and even create marketing funnels linked to aggregated data sources. In this tip you will learn how to create sales reports in Google Data Studio.
Data Studio is a free tool available at this link (+).
To start using it and exploit the potential of your data you will need to log in with your personal or corporate Google account, and then as it is your first report I recommend you start with an empty report. Immediately after that, Google Data Studio will ask you to link some data source according to your needs. Here you will find multiple possibilities, such as, linking to a Google spreadsheet, Google Analytics, Google Ads, YouTube (+) among others.
Once you have added your traffic source, you will be able to choose the theme that fits your needs in the right sidebar, search for the data source and import it with the view configuration of your choice. This can be a graph, a pivot table, a scorecard, among other options that will appear in the dropdown.
Once you have entered your data, your report will be linked to your data source. It is advisable to incorporate in your data panel a filter by period, which you will find in the . With this, your data will be displayed according to the date you want.
If you want to further improve the display of your data, it is advisable to select the data on your page and try different styles in the toolbar that will be enabled on the right side of the screen.
If you need to correct the added traffic source, look for the "Resource, manage added data sources" option at the top. Here you can add a new data source or edit the existing one.
Schedule periodic reporting
One of the options that Data Studio will give you is to schedule a report to your email. This option can be found at the top of the screen by clicking on the "share" button. There you can select the recipients, the subject of the email, the message in the body of the email and attach the PDF format at the same time.
Display report in presentation mode:
In its latest update Google Data Studio enabled the option to present your report in presentation mode. To do this, you must click on the "view" button on the top bar and then, to the right of it, three dots will appear that you must click on. Within this drop-down you will find this option that will be very useful when presenting your report.
As a free business intelligence tool, Google Data Studio is highly recommended for small and medium-sized businesses that want to optimise, visualise and share their data effectively without having to spend a lot of time or money.
Now with these steps you can start creating your customised panels! We encourage you to exploit the benefits of this great tool!
APPLY THIS TIP TO YOUR PROJECT
- 💻 PRACTICE with an expert in the next practical webinar.
- 🔎 CONSULT more related TIPs with this same theme.
- 📖 AMPLIA your knowledge by downloading this EBOOK.
THINK ABOUT YOU
- 🚀 IMPULSA your company in the next acceleration programme, ¡book your place now!
- 🥁 PRACTICE with your project in this practical webinar, ¡apply for your place!.
- 🌐 CONTACT with other entrepreneurs and companies, ¡register and take part in the next Networking!
THINK ABOUT HELPING OTHERS
- 🤝COLLABORATE as a volunteer: expert, mentor, inverter, awarding, Spreading the word, challenging, innovating, creating a TIP...
- 💬 RECOMMENDS this programme to reach out to more entrepreneurs by Google.
- 👉 SHARE your learning!
- 📲 SEND this TIP 👇
Rate this TIP!
Click on the stars to rate
Rating "5" - Average " - Average5"
No votes yet, be the first to vote!
We are sorry you did not find it useful.
Help us improve this TIP!
Leave us a comment and tell us how you would improve this TIP