
CREA REPORTES DE VENTA CON GOOGLE DATA STUDIO
Acelera tu empresa con estos consejos de expertos sobre «Crea reportes de venta con Google Data Studio». ¡Analiza y descubre esta TIP!
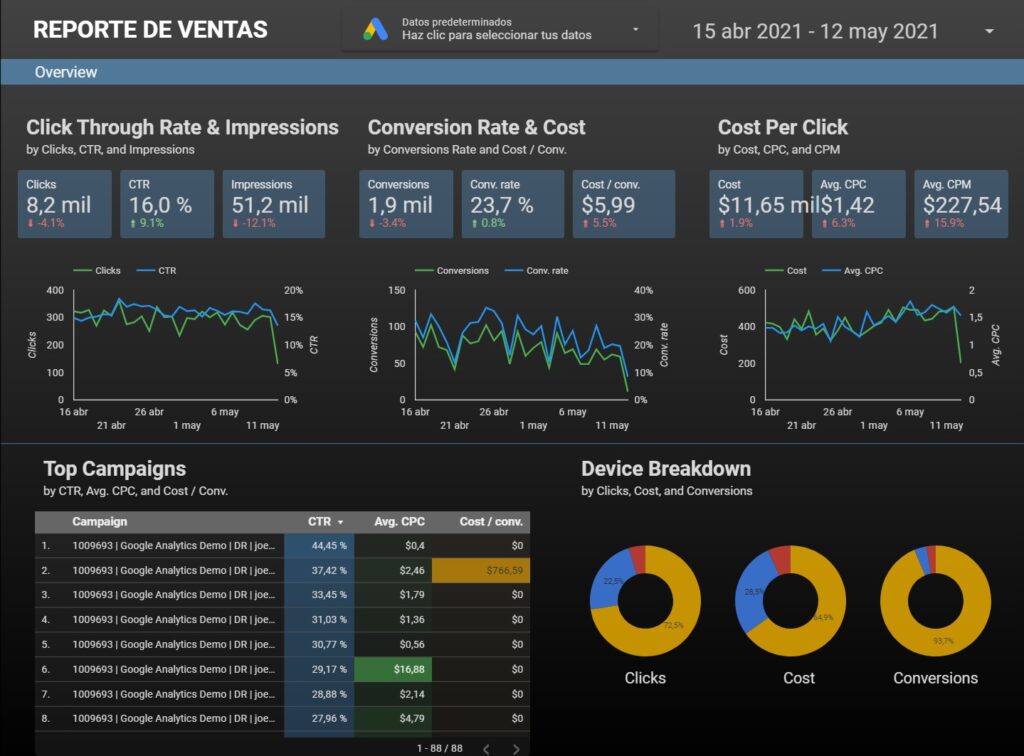
Google Data Studio es una rápida y poderosa herramienta de visualización de datos, que te permitirá vincular diferentes fuentes de tráfico para crear múltiples paneles que ajusten a tus necesidades de visualización, programar reportes de venta, gráficos e incluso crear embudos de marketing vinculados a fuentes de datos añadidas. Mediante esta Tip aprenderás a crear reportes de venta en Google Data Studio.
Data Studio es una herramienta gratuita disponible en este enlace (+).
Para comenzar a utilizarlo y explotar el potencial de tus datos deberás acceder con tu cuenta personal o corporativa de Google, y luego al ser tu primer reporte te recomiendo comenzar con un informe vacío. Inmediatamente después, Google Data Studio te pedirá vincular alguna fuente de datos según sea tu necesidad. Aquí te encontraras con múltiples posibilidades, tales como, vincularte a una hoja de cálculo de Google, Google Analytics, Google Ads, YouTube (+) entre otros.
Una vez añadida tu fuente de tráfico, podrás escoger en la barra lateral derecha el tema que se ajuste a tus necesidades, buscar la fuente de dato e importarla con la configuración de vista que elijas. Esta puede ser un gráfico, una tabla dinámica, tarjeta de resultado, entre otras opciones que aparecerán en el desplegable.
Una vez tengas incorporados tus datos, Tu reporte se encontrará vinculado a tu fuente de datos. Es recomendable incorporar en tu panel de datos un filtro por período, el cual encontrarás en la . Con esto, tus datos se visualizarán de acuerdo a la fecha que desees.
Si quieres mejorar más aún la visualización de tus datos, es recomendable seleccionar los datos en tu página y probar distintos estilos en la barra de herramientas que se habilitará en la parte derecha de la pantalla.
Si necesitas corregir la fuente de tráfico añadida, busca en la parte superior la opción «Recurso, gestionar fuentes de datos añadidas». Aquí podrás añadir una nueva fuente de datos o editar la existente.
Programar reporte periódico
Una de las opciones que te entregará Data Studio es programar un reporte a tu correo electrónico. Esta opción se encuentra en la parte superior de la pantalla botón “compartir”. Ahí podrás seleccionar los destinatarios, asunto del correo, mensaje en cuerpo del correo y adjuntar al mismo tiempo el formato en PDF.
Visualizar reporte en modo presentación:
En su última actualización Google Data Studio habilitó la opción de presentar tu reporte en modo presentación. Para esto, deberá pinchar el botón “ver” de la barra superior y luego, a la derecha de este, aparecerán tres puntos que deberás pinchar. Dentro de este desplegable encontrarás esta opción que te será de mucha utilidad al momento de presentar tu reportería.
Google Data Studio al ser una herramienta de inteligencia de negocios gratuita, es muy recomendable para la pequeña o mediana empresa que desea optimizar, visualizar y compartir sus datos de manera efectiva sin tener que gastar mucho tiempo o dinero.
¡Ahora con estos pasos ya podrás comenzar a crear tus paneles personalizados! ¡Te animamos a explotar las bondades de esta gran herramienta!
APLICA ESTE TIP EN TU PROYECTO
- 💻 PRACTICA con un experto en el próximo webinar práctico.
- 🔎 CONSULTA más TIPs relacionadas con este mismo tema.
- 📖 AMPLIA tus conocimientos descargando este EBOOK.
PIENSA EN TI
- 🚀 IMPULSA tu empresa en el próximo programa de aceleración, ¡reserva tu plaza ya!
- 🥁 PRACTICA con tu proyecto en este webinar práctico, ¡solicita tu plaza!.
- 🌐 CONTACTA con otros emprendedores y empresas, ¡inscríbete y participa en el próximo Networking!
PIENSA EN AYUDAR A LOS DEMÁS
- 🤝COLABORA como voluntario: experto, mentor, inversor, premiando, difundiendo, retando, innovando, creando una TIP…
- 💬 RECOMIENDA este programa para que llegue a más emprendedores por Google.
- 👉 ¡COMPARTE tu aprendizaje!
- 📲 REENVÍA esta TIP 👇

